Earth Science worksheet
    Topic: The Solar System
    The Solar System
    Base your answers to questions 1 on the diagram below and on your knowledge of Earth science. The diagram represents the elliptical orbit for one planet in our solar system. The two foci of the orbit are shown as the Sun and F2.

    seasons-and-astronomy, the-solar-system, standard-1-math-and-science-inquery, velocity-slope-sediment-size-channel-shape-stream-valume-distance-from-the-sun-gravitational-force-period-of-revolution-speed-of-revolution, standard-6-interconnectedness, models fig: esci-v202-exam_g30.png

    1

    Which condition would produce an orbit with a greater eccentricity?

    (1) a decrease in the distance between the Sun and F2

    (2) an increase in the distance between the Sun and F2

    (3) a constant decrease in the orbital velocity of the planet

    (4) a constant increase in the orbital velocity of the planet

    Base your answers to questions 2 on the diagram below and on your knowledge of Earth science. The diagram represents one position of Earth in its orbit around the Sun and 12 constellations that can be seen in the night sky by an observer in New York State at different times of the year. The approximate locations of the constellations in relation to Earth’s orbit are shown. Point A represents another position in Earth’s orbit.

    seasons-and-astronomy, earth-revolution, standard-6-interconnectedness, models fig: esci-v202-exam_g37.png

    2

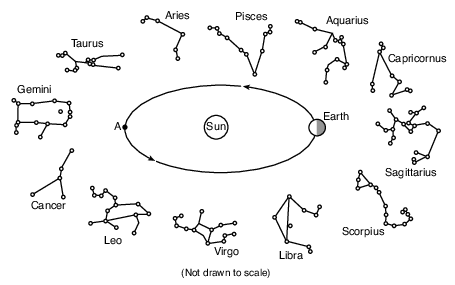
    Approximately how many days (d) does it take for Earth to orbit from its present position to point A?

    (1) 27 d

    (2) 91 d

    (3) 183 d

    (4) 365 d

    3

    Which planet’s day (period of rotation) is longer than its year (period of revolution)?

    (1) Mercury

    (2) Venus

    (3) Jupiter

    (4) Saturn

    4

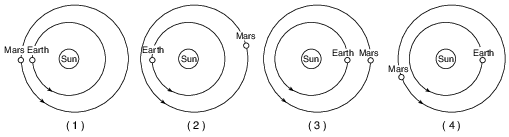
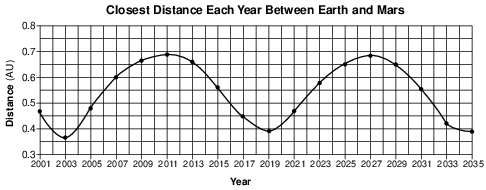
    The diagram below shows the relative positions of Earth and Mars in their orbits on a particular date during the winter of 2007.

    reference-tables, solar-system-data, seasons-and-astronomy, the-solar-system, standard-1-math-and-science-inquery, velocity-slope-sediment-size-channel-shape-stream-valume-distance-from-the-sun-gravitational-force-period-of-revolution-speed-of-revolution, standard-6-interconnectedness, patterns-of-change fig: esci12012-examw_g8.png

    Which diagram correctly shows the locations of Earth and Mars on the same date during the winter of 2008?

    reference-tables, solar-system-data, seasons-and-astronomy, the-solar-system, standard-1-math-and-science-inquery, velocity-slope-sediment-size-channel-shape-stream-valume-distance-from-the-sun-gravitational-force-period-of-revolution-speed-of-revolution, standard-6-interconnectedness, patterns-of-change fig: esci12012-examw_g9.png

    (1) 1

    (2) 2

    (3) 3

    (4) 4

    5

    Which planet has completed less than one orbit of the Sun in the last 100 years?

    (1) Mars

    (2) Mercury

    (3) Neptune

    (4) Uranus

    Base your answers to questions 6 on the diagram below and on your knowledge of Earth science. The diagram represents Earth’s revolution around the Sun. Points A, B, C, and D represent Earth’s positions in its orbit on the first day of each of the four seasons. The major axis and the foci (the center of the Sun and the other focus) of Earth’s orbit are shown.

    reference-tables, solar-system-data, seasons-and-astronomy, motion-of-objects-in-the-solar-system, standard-1-math-and-science-inquery, eccentricity-rate-gradient-standard-error, standard-1-math-and-science-inquery, geocentric-model-heliocentric-model, standard-1-math-and-science-inquery, changing-length-of-a-shadow-based-on-the-motion-of-the-sun, standard-6-interconnectedness, models fig: esci12015-examw_g36.png

    6

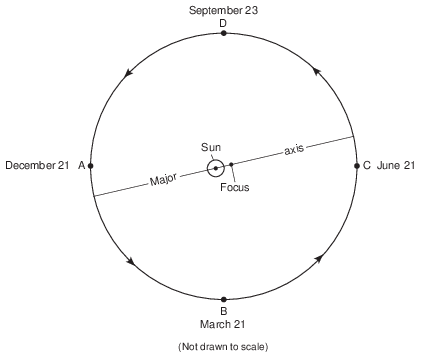
    Since Earth has an elliptical orbit, the

    (1) distance between the Sun and Earth varies

    (2) distance between the Sun and the other focus varies

    (3) length of Earth’s major axis varies

    (4) length of Earth’s period of revolution varies

    7

    Earth’s rate of revolution is approximately

    (1) 1° per day

    (2) 15° per day

    (3) 23.5° per day

    (4) 360° per day

    Base your answers to questions 8 on the graph below and on your knowledge of Earth science. The graph shows the closest distance between Earth and Mars during each year from 2001 to 2035. Distances are measured in astronomical units (AU). One AU equals the average distance from Earth to the Sun.

    seasons-and-astronomy, the-solar-system, standard-1-math-and-science-inquery, velocity-slope-sediment-size-channel-shape-stream-valume-distance-from-the-sun-gravitational-force-period-of-revolution-speed-of-revolution, standard-6-interconnectedness, patterns-of-change fig: esci12018-examw_g36.png

    8

    How many million kilometers is one astronomical unit?

    (1) 108.2 million km

    (2) 149.6 million km

    (3) 227.9 million km

    (4) 377.5 million km

    9

    Which characteristic is directly related to a planet’s average distance from the Sun?

    (1) period of revolution

    (2) period of rotation

    (3) eccentricity of orbit

    (4) equatorial diameter

    Base your answers to questions 10 on the calendar below, on the diagram in image provided, and on your knowledge of Earth science. The calendar shows the phases of the Moon for January 2019 as viewed by an observer in New York State. Some phases have been labeled. The diagram on your answer sheet represents eight positions of the Moon in its orbit around Earth.

    seasons-and-astronomy, motion-of-objects-in-the-solar-system, standard-6-interconnectedness, models, standard-6-interconnectedness, patterns-of-change fig: esci-v202-exam_g48.png

    10

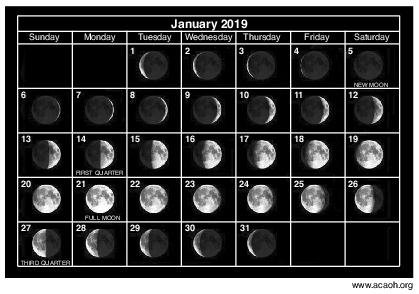
    A New Moon occurred on January 5, 2019. Determine the date of the New Moon that occurred in February 2019. [1]

    February____________ , 2019

    Allow 1 credit for February 3, 2019 or February 4, 2019.

    Base your answers to questions 11 on the diagram below, which shows the Moon at position 1 in its orbit around Earth. Numbers 2 through 8 represent other positions in the Moon’s orbit.

    seasons-and-astronomy, motion-of-objects-in-the-solar-system, standard-6-interconnectedness, models, standard-6-interconnectedness, patterns-of-change fig: esci12012-examw_g35.png

    11

    How many days does it take the Moon to go from one full-Moon phase to the next full-Moon phase when viewed from Earth? [1]

    d

    Allow 1 credit for any value from 29 d to 30 d.

    Base your answers to questions 12 on the diagram in image provided, which represents eight positions of the Moon in its orbit around Earth.
    12

    Using the terms rotation and revolution, explain why the same side of the Moon always faces Earth. [1]

    Allow 1 credit. Acceptable responses include, but are not limited to:

    • — The Moon’s period of rotation equals its period of revolution.

    • — The Moon rotates and revolves once in 27.3 days.

    • — The Moon rotates and revolves at the same rate.

    Base your answers to questions 13 on the passage and data table below, which describe the exploration and characteristics of one of Saturn’s moons, Titan.

    Huygens Probe Lands on Titan

    The Huygens probe was carried to Saturn by the Cassini spacecraft and parachuted to the surface of Saturn’s giant moon, Titan. The Huygens probe’s landing site was littered with smooth, rounded, rocklike objects. Photographs taken of Titan’s surface show drainage channels leading to an apparent shoreline. The question is, what are they draining? One of the photographs seems to show ground fog consisting not of water, but perhaps of ethane or methane.

    landscapes, erosion-and-natural-agents-of-erosion, dynamic-earth, landforms, landscapes fig: esci12013-exam_g46.png

    13

    Approximately how many times farther is Titan from Saturn than Earth’s Moon is from Earth? [1]

    times farther

    Allow 1 credit for any value from 3.0 to 3.2 times farther.

    Base your answers to questions 14 on the diagram in image provided and on your knowledge of Earth science. The diagram represents the orbits of Earth, Venus, and Mercury. Earth, Venus, and Mercury are shown with a dot on each of their orbital paths. The numbers on each orbital path indicate the planet’s positions on successive days in its revolution. Point M is a position on Earth’s orbit. Each season in the Northern Hemisphere on Earth is labeled.
    14

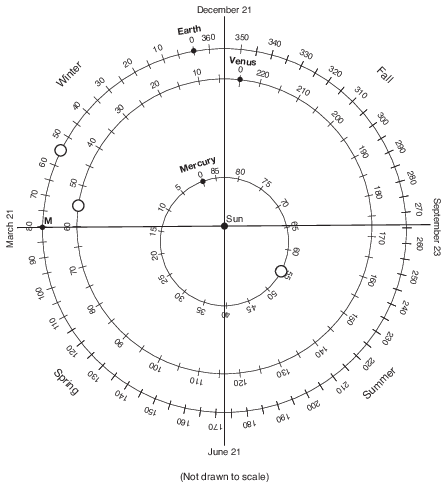
    On the diagram in the image provided, place an X on each planet’s orbital path to show the positions of Earth, Venus, and Mercury on the 55th day of each planet’s orbit. [1]

    seasons-and-astronomy, motion-of-objects-in-the-solar-system, seasons-and-astronomy, the-solar-system, standard-6-interconnectedness, models fig: esci12014-ansbk_abkq8.png

    Allow 1 credit if the centers of all three Xs are within the circles shown below.

    • Note: Do not allow credit if more than one X is placed on any orbit.

    • Allow credit even if a symbol other than an X is used.. It is recommended that an overlay of the same scale as the student answer booklet be used to ensure reliability in rating.

    seasons-and-astronomy, motion-of-objects-in-the-solar-system, seasons-and-astronomy, the-solar-system, standard-6-interconnectedness, models fig: esci12014-rg_g8.png

    Base your answers to questions 15 on the data table below and on your knowledge of Earth science. The table shows the distances from Earth to the Moon for certain days during December 2010. The percent of the Moon illuminated by the Sun as seen from Earth is also given.

    seasons-and-astronomy, motion-of-objects-in-the-solar-system, seasons-and-astronomy, the-solar-system, standard-1-math-and-science-inquery, eccentricity-rate-gradient-standard-error fig: esci12016-examw_g44.png

    15

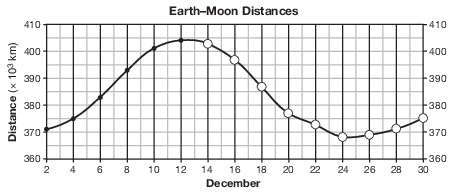
    On the grid in the image provided, the Earth–Moon distance data from December 2 to December 12 have already been plotted. Complete the line graph by plotting the Earth–Moon distances from December 14 to December 30. Continue the line from December 12 through all nine of your plotted points. [1]

    seasons-and-astronomy, motion-of-objects-in-the-solar-system, seasons-and-astronomy, the-solar-system, standard-1-math-and-science-inquery, eccentricity-rate-gradient-standard-error fig: esci12016-ansbk_abkq2.png

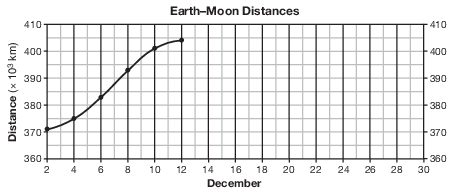
    Allow 1 credit if the centers of all nine of the student’s plots are within or touch the circles shown and all 15 plots are correctly connected with a line that passes within or touches each circle.

    • Note: Allow credit if the line misses a plot but is still within or touches the circle.

    • It is recommended that an overlay of the same scale as the student answer booklet be used to ensure reliability in rating.

    seasons-and-astronomy, motion-of-objects-in-the-solar-system, seasons-and-astronomy, the-solar-system, standard-1-math-and-science-inquery, eccentricity-rate-gradient-standard-error fig: esci12016-rg_g2.png